
Hello!
A quick email today to share that you can now create Streamgraph with AdvViz:
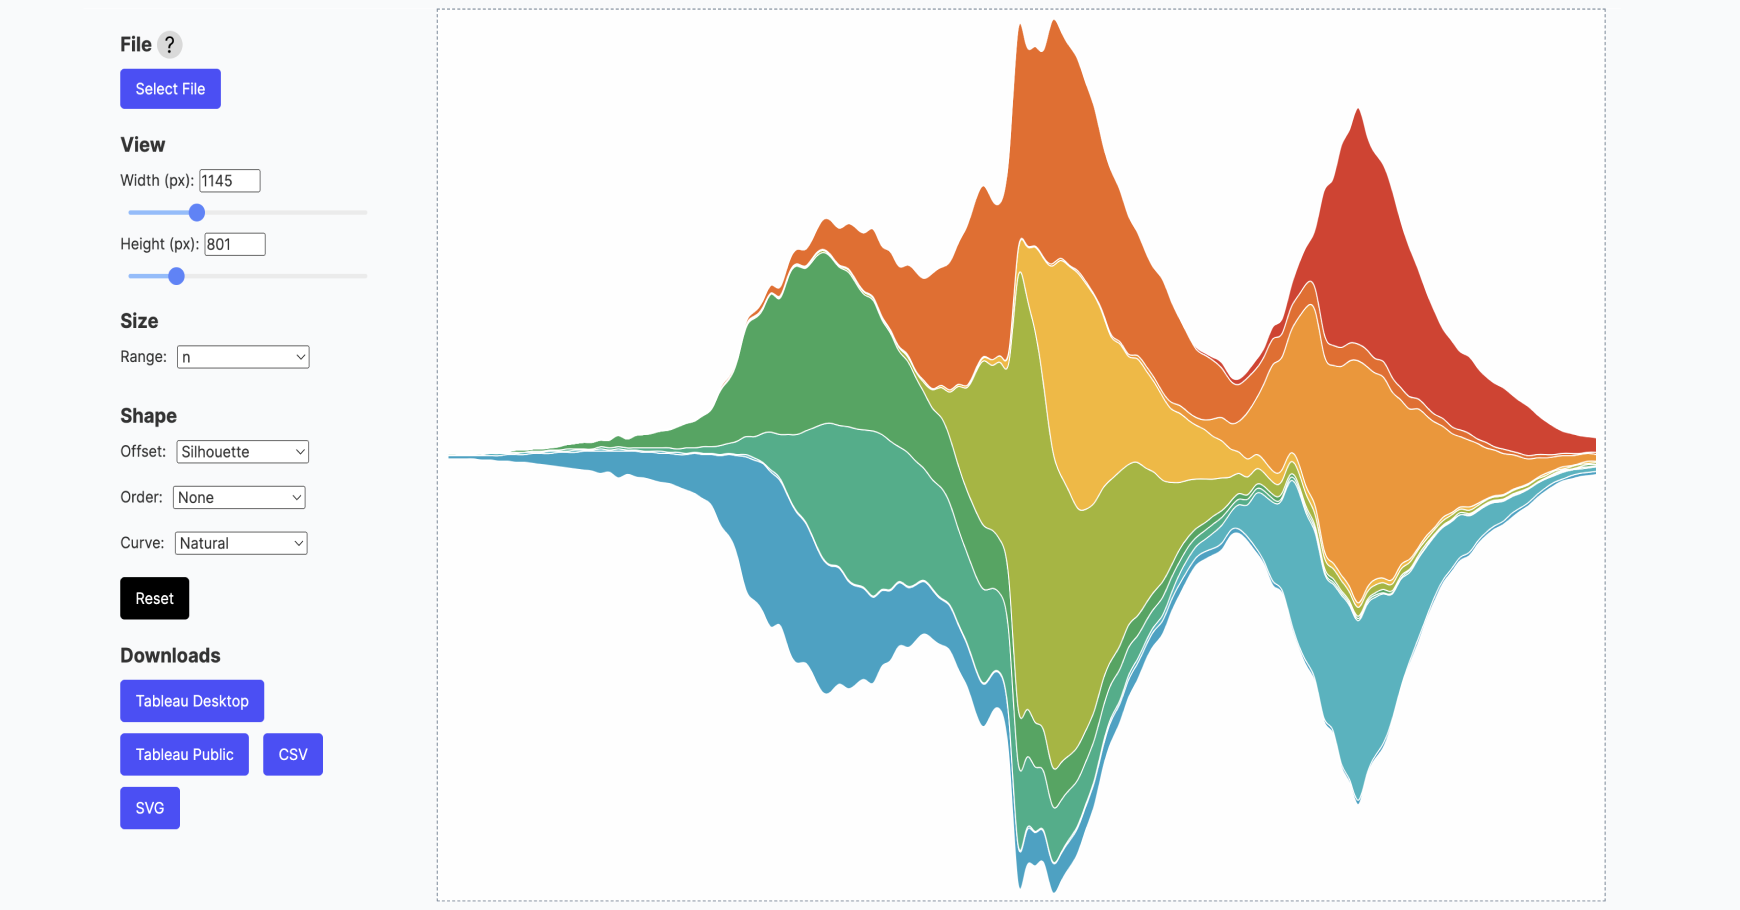
If you have used any of the previous generators, this works exactly the same way: select our data, configure the chart, and export the result to Tableau in one click:

The data structure is really simple; you need a CSV or Excel file with three columns: the ID, the date, and the value. Here’s an example:

As with all the other generators, this is 100% free, and you can export the result in Tableau and as a CSV or SVG.
We are already working on a new generator! If you like this new one, and want to help us create more of them faster, you can buy us some coffee ☕️

If you build a Tableau Public visualization using this tool, please mention us @ladataviz so we can add the viz in the gallery!
That’s it for this week!
You can reach us easily over there:
‣ Website: https://www.ladataviz.com
‣ Twitter/X : https://twitter.com/ladataviz
‣ Youtube: https://www.youtube.com/@ladataviz
‣ LinkedIn: https://www.linkedin.com/in/ladataviz/
‣ All other links: https://linktr.ee/ladataviz
If you have any suggestions, feedback is appreciated!