Hi 👋
In May, during the Tableau Conference, I discussed three personal revolutions: the evolution of the tool I use, advancements in building complex charts in Tableau, and the potential impact of AI in realizing your dream product. Today, I'd like to continue this theme.
Changes are coming for you and the way you use Tableau. You may have already heard about it, but let me briefly summarize the benefits of BANg through a new Youtube video and talk about the upcoming new features. But that's not all, and I’m working on new revolutionary tools!
Changes are coming for me and the way I run Ladataviz. I reached a point where working for my clients, building new tools, and creating content is unsustainable. Ladataviz needs to evolve.
Before I start, let me say thank you for reading this! You are almost 800 subscribers. With the current state of social networks, it’s good to know there’s still a place where I can share exciting news!
Finally, I know I said the newsletter would be published Monday, so I’m giving you three more days to use the 50% discount on BANg. The code is at the bottom of the email!
BANg - Create KPIs in Tableau in 10 minutes
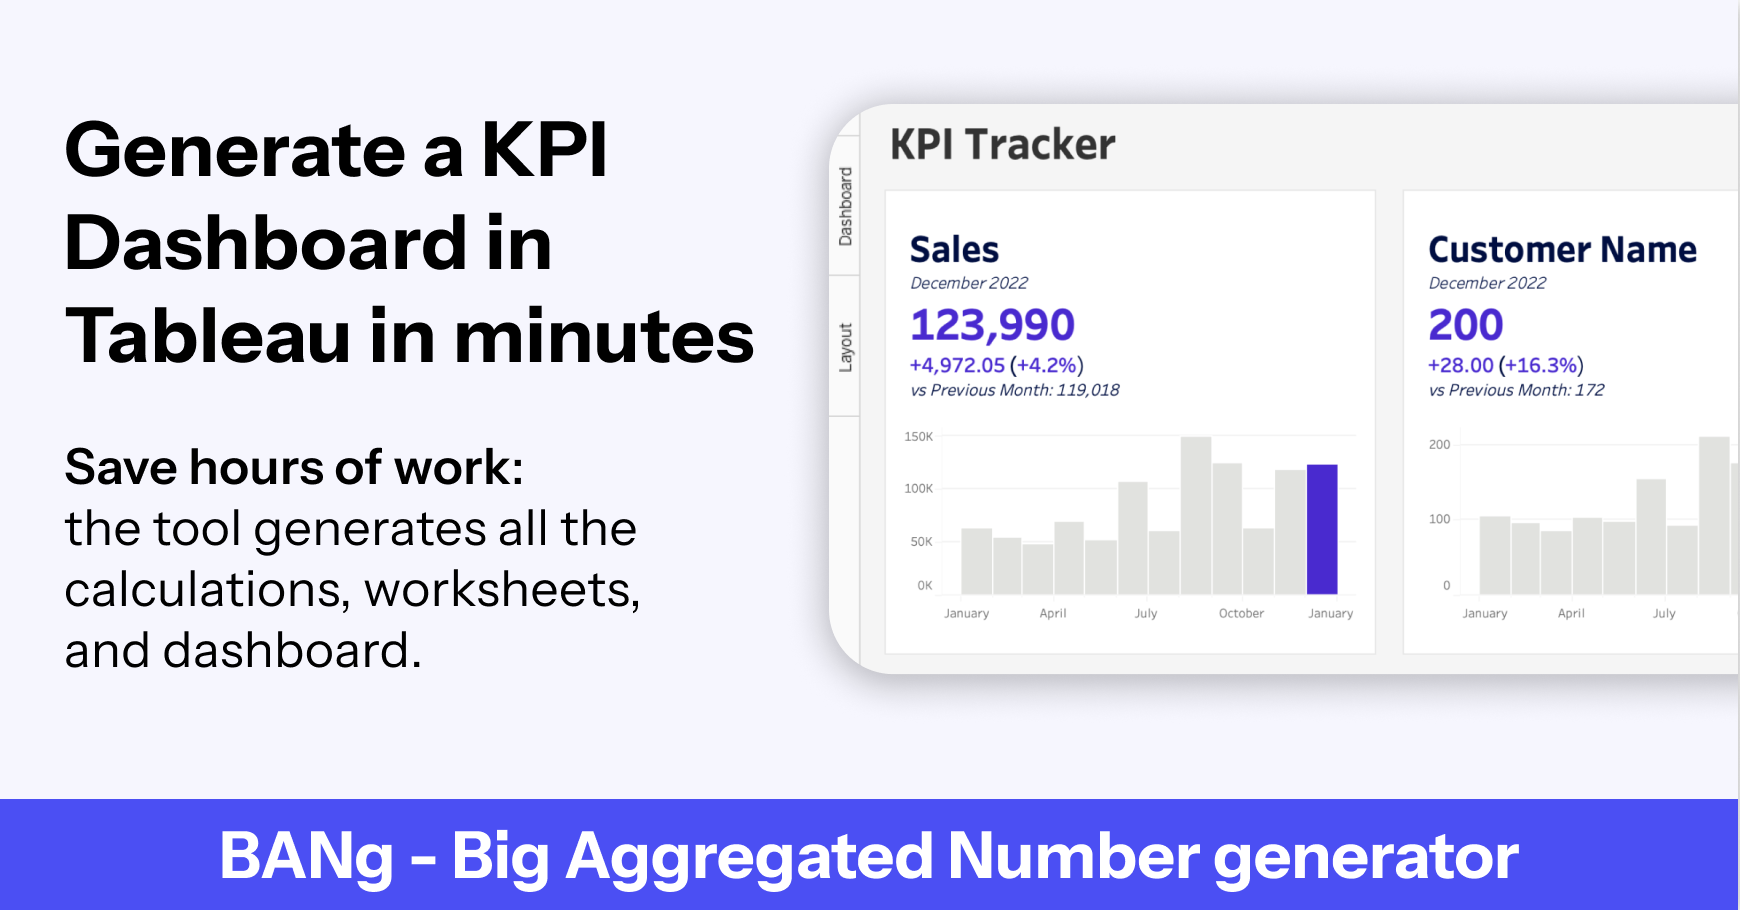
I launched BANg (Big Aggregated Number Generator) a month ago. It is my first paid product that allows you to generate a KPI Dashboard in Tableau in just ten minutes.
How does it work? How easy is it to use? Is it safe?
I received a lot of questions (and already corrected a few bugs!), and there’s no better way to show you what the tool is really about than a video! So if you give me ten minutes of your time, let me show you how BANg can help you save hours of repetitive and annoying work:
Thanks to all the early adopters, I already received feedback that will help me improve the tool in the coming months. Here’s what you can expect:
An option to compare with a target
Generate KPIs based on different data sources
Show the trend as a line chart or area chart
Generate the calculations without the sheets or dashboard
Generate just the worksheet and dashboard if you already have all the calculations ready
You can use the tool for free for a week, so give it a try!
Ladataviz is evolving
In May 2020, I started working as a freelancer. This was a long-time personal goal, and the state of the world at that time was the final push to start.
I created my company, Ladataviz, and started helping clients with their Tableau needs. I stayed in my comfort zone and worked a lot, fighting the uncertainties of the outside world by doing what I knew best.
Flash forward three years later, and every week is a delicate balance between working for clients, supporting the existing tools while building new ones, and answering everyone while creating new content. It is a very delicate balance. And not something I can continue doing alone.
In September, LADATAVIZ is doubling in size! It will no longer be a one-person company but a small data visualization studio of two 🚀
What does it mean for you? More content, more time to build tools, and answer all your questions. I’m really excited about this change, and I can’t wait for it!
So watch this space 👇 because it’s changing soon!
I don’t plan to hire anyone else in the near future. My goal is not to grow a big business and have many employees. I want to keep things small, agile, fun, and above all, keep the freedom that allows me to build cool things for you.
What’s next in Q3?
My first goal for Q3 was to release BANg ✅ and with that, I also accomplished another big milestone: generating my first income that did not come from selling my time ✅.
My second goal was to rewrite my website completely with Svelte and have a login for AdvViz. As I released more and more tools, the user experience must be smooth across the different pages.
I was afraid of the impact of all those changes, but in the end, the number of views on my website has increased, and 300 people have already created an account on ladataviz! Thank you!

But I didn’t answer the question. What is next?