
Hey, it’s been a while!
March was probably the busiest and most challenging month since we started LaDataViz.
We are now back home and ready to share some news!
See you at the Tableau Conference!
The Tableau Conference starts in less than two weeks, and we hope to see you there!
This year is a bit special for us because we joined eight other small companies to help sponsor the two main pre-conference events: Data+Tacos and Data+Women.

On top of that, I’ll also present a new edition of “Beyond the Boundaries of Tableau” with, as always, some surprises!
The presentation will be repeated twice; if you can’t make it to San Diego, it will also be available online!
This year, you must reserve a seat to attend the talk, so use this link to secure your spot. Last year, both sessions were packed.

Finally, we have one last surprise for you at the Tableau Conference, but I can’t yet talk about it 🤫 .
Product updates
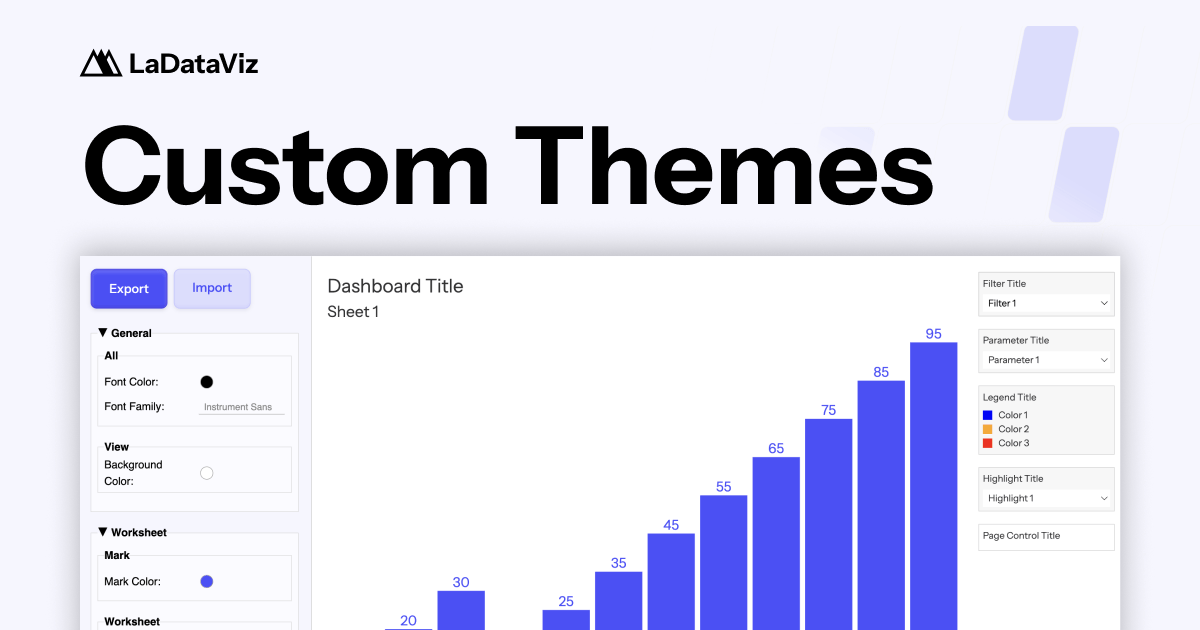
At the end of February, we released the Custom Theme Generator. This new (and free) product was quite a success, and we received great feedback from the Tableau team behind the feature.
In March, and mostly because of the last-minute surprise mentioned in the previous section, we worked on different enhancements and new extensions but couldn’t make any official release.
Everything is ready for some exciting new release in April.
We are currently working on:
A major update for BANg - Big Aggregated Number Generator
Chart selection for the Figma to Tableau Plugin
New Viz Extensions (curved line, ranked area)
Video tutorial for Viz Extensions (with some exciting collaboration!)
Finally, you continue using our first product, AdvViz, to create Tableau Public visualizations with advanced charts. Thank you! Jessica updated the gallery, showing more than 300 visualizations and 45 VOTD!

For us, everything started with this handy tool we gave to the community, and we can’t wait to share more about what’s next!
Stay tuned!